
From Compliance to Strategy
Turning ESG Data into Insights
For most sustainability teams, the reporting season is a frantic dash to a finish line. You gather data, validate it, and hit “submit” on a massive PDF. But once the report is filed, that data often sits in a digital drawer until the following year.
In 2026, forward-thinking manufacturing and retail groups are realizing that ESG data shouldn’t just be a backward-looking compliance chore. When visualized correctly, it becomes a forward-looking strategic asset.
The Problem with “Dead Data”
Traditional ESG reporting relies on static spreadsheets. The issue? Spreadsheets are great for storing numbers, but they aren’t built for spotting patterns.
- The Lag: By the time you see a spike in energy consumption in a quarterly report, three months of potential savings are already lost.
- The Silo: It’s difficult to see how a carbon reduction initiative in one factory is performing compared to another across your group hierarchy.
- The Noise: Without visualization, it’s nearly impossible for leadership to quickly grasp the “big picture” amidst thousands of data points.
How Planmark’s Dashboards Drive Better Strategy
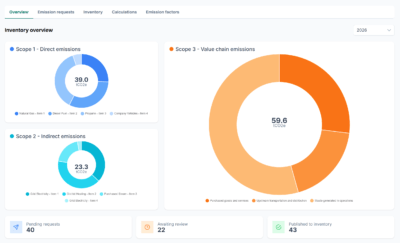
Planmark doesn’t just collect your data; it translates it into a language that management and stakeholders understand. Our built-in analytics and visualization tools turn raw numbers into a real-time command center.
- Real-Time Performance Tracking Instead of waiting for an annual summary, Planmark’s dashboards provide a live view of your KPIs. If a specific site’s Scope 2 emissions trend upward unexpectedly, you see it instantly. This allows for “interventional management”—fixing the problem today rather than reporting the failure next year.
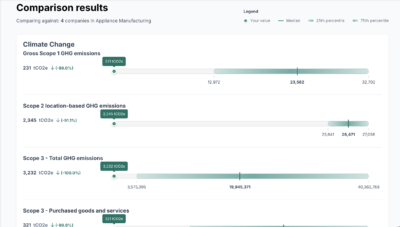
- Benchmarking Across the Group: For groups with multiple subsidiaries or sites, our visualization tools allow you to compare performance side-by-side. You can identify your “Sustainability Champions”—the sites with the best energy efficiency or waste reduction—and scale their best practices across the entire organization.
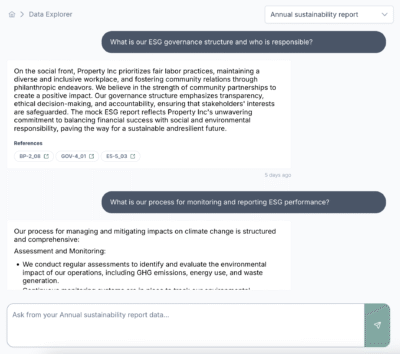
- From “Searching” to “Knowing”: With our Data Explorer, you aren’t just looking at static spreadsheets; you are interacting with your company’s collective knowledge. Instead of manually digging through hundreds of uploaded documents to find specific details, you can ask the software directly. “What is our current approach to supplier environmental risk?” or “Summarize our waste management protocols across our German sites.” Having this information at your fingertips makes it significantly easier to provide evidence-backed answers during board meetings or investor inquiries.
Building a “Digital Audit Trail” of Success
The beauty of visual analytics is that they also serve as a high-level view of your Audit Governance. When an auditor or investor asks for proof of progress, you don’t send them a folder of receipts; you show them a validated trend line that is traceable back to the raw source.
By moving away from “Excel fatigue” and toward visual insights, you shift the internal perception of the sustainability department. You aren’t just the “compliance office”—you are the department providing the data that drives operational efficiency and long-term value.
The Insight Dividend: When data is visual, it becomes actionable. The goal of Planmark isn’t just to help you report on the past, but to give you the clarity needed to build a sustainable future.
Stop Guessing, Start Seeing
ESG data is only valuable if you can use it to make decisions. Try it out and see how Planmark’s built-in analytics can turn your compliance data into your company’s greatest strategic advantage.